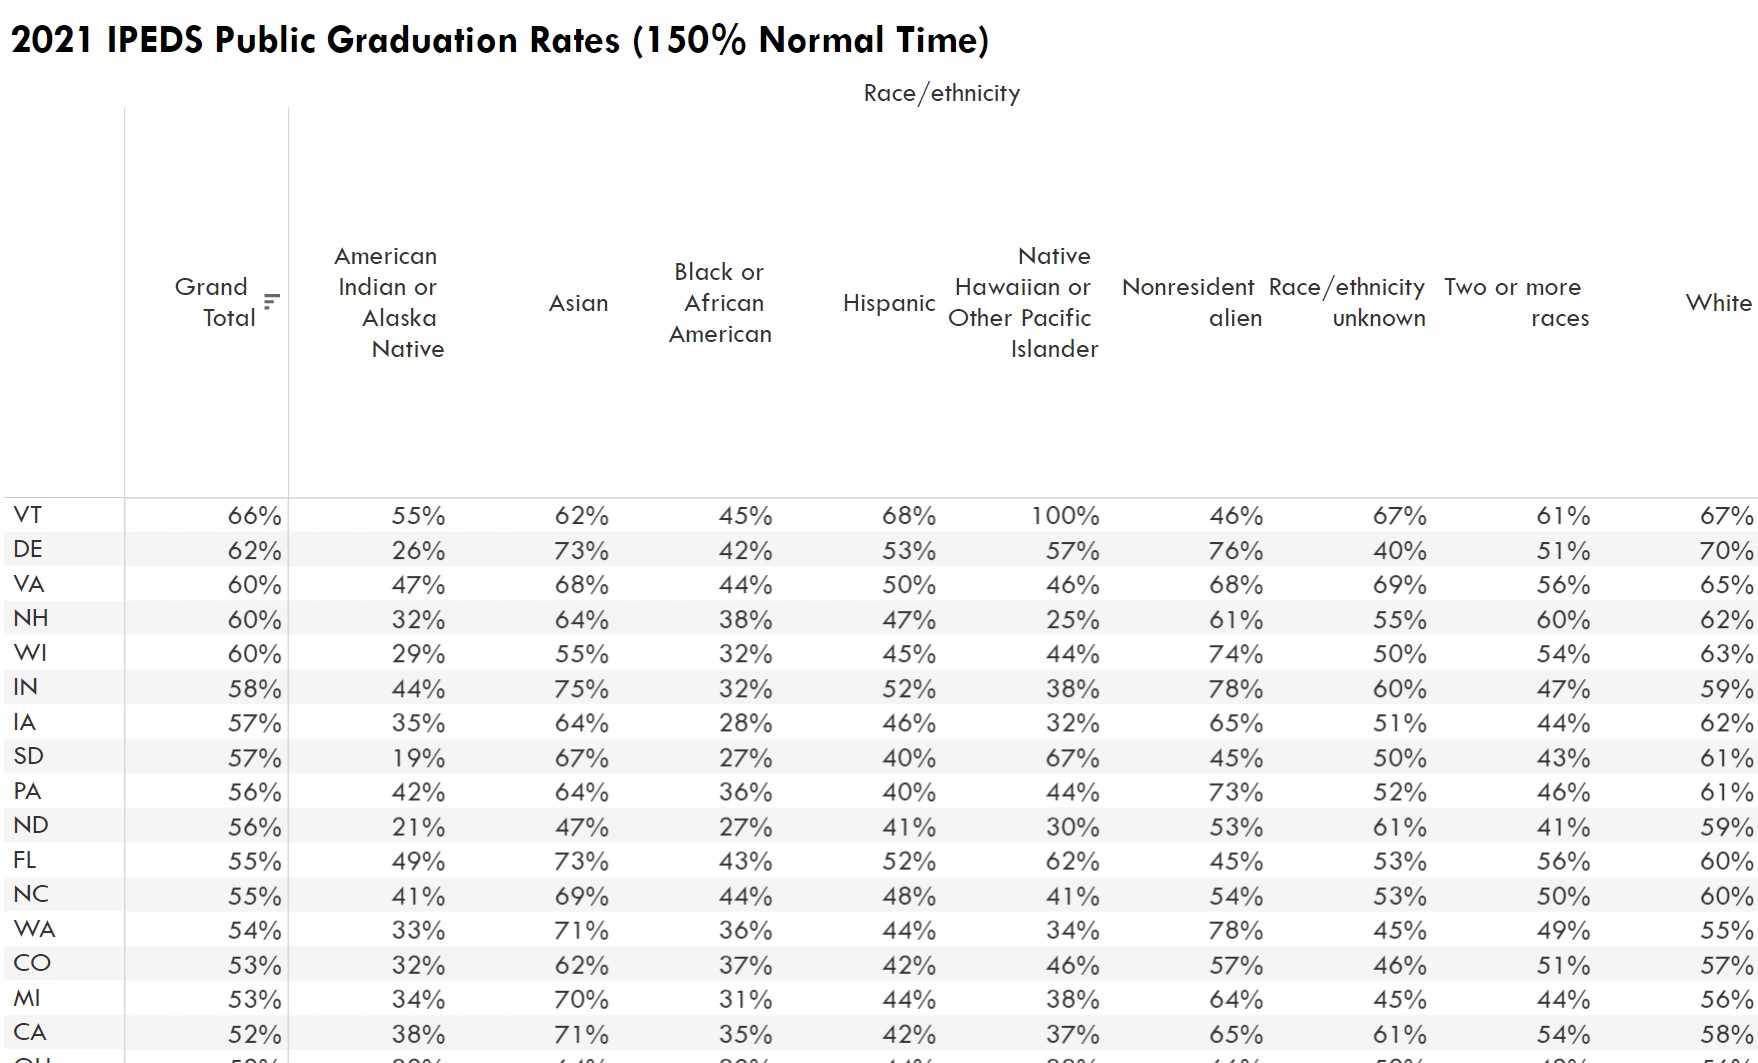
In the latest IPEDS graduation rate data (2021 graduates), Pennsylvania’s two-year (primarily associate degree) public institutions ranked 14th among the 50 states, and its four-year (primarily bachelor’s) institutions ranked 37th in the percent of students completing within 150% of the normal time. (I know and agree with many of the arguments about IPEDS grad rates, but this isn’t really about that).
By contrast, Florida’s primarily associate institutions collectively ranked 5th, and its primarily bachelor’s institutions ranked 4th.
So which state was higher overall? The one with sectors ranked 14th and 37th or the one where they ranked 4th and 5th?
The answer–Pennsylvania at 9th overall compared to Florida at 11th–has to do with a statistical phenomenon that often produces counterintuitive results in a postsecondary system where the data are more often organized from an institutional than from a student perspective. It happens surprisingly often and can lead to some misguided policy decisions if we don’t know to look for it.
In this case, what happens is that selectivity in bachelor’s institutions tends to increase graduation rates not just there but in community colleges as well. If a B+ student is rejected from a four-year institution and goes to a community college instead, both the four-year and the community college graduation rates might go up as a result. But is that student more likely to graduate than if they had been accepted at the four-year school? Very likely not, if for no other reason than the pervasive and shameful underfunding of community colleges nationwide. The result appears to be a performance improvement, but in fact it may be the opposite.
Pennsylvania might be tempted to improve its four-year graduation rates by increasing selectivity, and indeed that would likely improve the sector-level rankings for both two- and four-year schools, but it could also produce a negative result overall for the state and its students.
Graduation rates are not the only area where Simpson’s paradox can produce surprising results in higher education. Consider these possibilities as well:
- Tuition is flat or frozen at all institutions but the average student is paying more because enrollment is growing at the higher-tuition institutions
- Diversity is increasing faster at every institution in a state than it in statewide totals (if the the least diverse institutions grow fastest)
- Faculty salaries are higher for both men and women at one institution than at another, but lower overall because of the gender composition of the faculty
There are undoubtedly many other potential examples as well.
It may not always be possible to see the whole picture. Policymakers often have more information about public institutions than private ones, for example, while students, faculty and staff aren’t confined only to the public sector. But there are a few things the policy and research community can keep in mind:
- Always aggregate. While “disaggregate the data” is often a good mantra for analysts, it should not be at the expense of the bottom line.
- Remember to count. Averages and rates are subject to Simpson’s paradox, but integers are not. If two institutions each graduated more students than they did last year, then the collective total will always be higher as well.
- Expand the (data) universe. Thinking too narrowly within a sector or even a state can cause us to miss what the world looks like or how it is changing from students’ or potential students’ perspective.

